 Positioning the mouse cursor on the page element, the user can obtain a short description in the tooltip.
Technique Comparison
In a two-dimensional scatter plot, the data of thermodynamic parameters obtained by different instrumental techniques are compared.
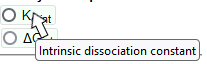
Tooltips
Positioning the mouse cursor on the page element, the user can obtain a short description in the tooltip.
Selecting thermodynamic parameter
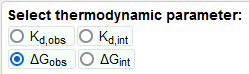 Users can select the thermodynamic parameter to show in the graph window.
Selecting methods on axes
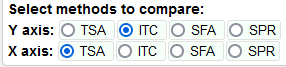 The four instrumental methods can be set on the X and Y axes.
Selecting proteins
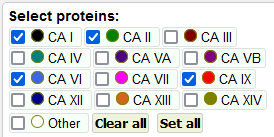 For selecting exposable protein groups, use Clear all and Set all buttons or checkboxes for individuals.
Set colors of data points
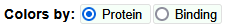 Colors of data points can be set according to protein group or protein-ligand binding strength.
Filters
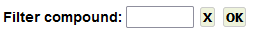 Case insensitive search by compound name fragment. After writing the string in the edit line, mouse-click on OK button or press the Enter key.
Loading data
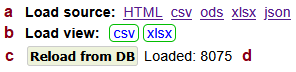 Source data control elements. The tool uses `all_method_kd_obs_stats_log10` and `all_method_kd_int_stats_log10` database tables (views).
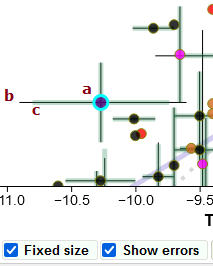
Data point info
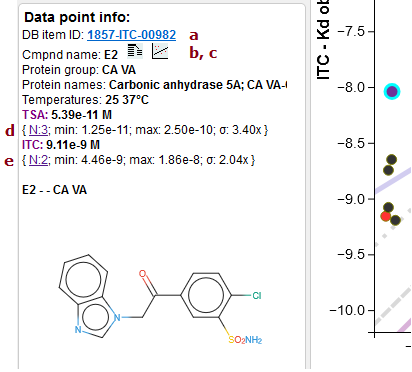 Information about selected data point in the graph area appears in the left panel card.
Current graph data points info
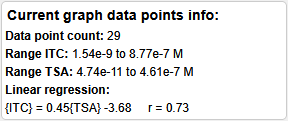 This left panel card shows short statistics for all visible data points.
Graph card controls
 a The "Fixed scale" check box switches between a fixed (maximal, default) axis scale range and a dynamic one.
Graph card functionality
 Zoom
Zoom
API

URL-defined compounds highlighting
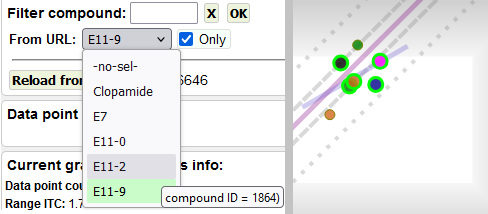 Use the From URL combo box to highlight data points with compounds passed through the compounds URL parameter.